
About me
Do you know the difference between education and experience? Education is when you read the fine print; experience is what you get when you don't.
— Pete Seeger

Latest Articles:
Fault Tree Analysis:
Root Cause Analysis Technique – A Deep Dive
In this article:
Introduction
Picture this: a critical e-commerce application crashes during peak holiday shopping, leaving thousands of users staring at error messages. The incident response team restores service within an hour, but the post-incident review reveals a complex web of contributing factors – a database node ran out of memory, the failover system didn’t kick in due to a configuration error, and an influx of traffic exposed a hidden software bug. For IT Service Management (ITSM) professionals, such multi-faceted failures are daunting; simple root cause methods (like asking “5 Whys”) might latch onto one symptom and miss other contributors. This is where Fault Tree Analysis (FTA) shines. FTA is a systematic, structured technique that breaks down exactly how multiple things can go wrong in concert (Reliability, n.d.). It enables IT teams to map out all potential causes of an incident in a logical diagram, showing how those causes combine to produce the top-level failure.
Originally developed in the 1960s for aerospace and other high-risk engineering projects, Fault Tree Analysis has evolved into a powerful problem-management tool for IT – especially in complex environments where failures rarely have a single root cause (Reliability, n.d.; Atlassian, n.d.). In this deep dive, we’ll explore FTA’s origins and theoretical foundations, walk through its methodology (from defining a top event to using logic gates and even calculating event probabilities), and discuss how you can apply FTA to real ITSM scenarios like service outages, cascading failures, and change deployment issues. We’ll also compare FTA with other root cause analysis techniques (such as the 5 Whys and Ishikawa “fishbone” diagrams) and provide practical steps for implementing FTA in modern ITSM processes – including recommendations on tools for diagramming and analysis. By the end, you’ll see why FTA – though born in safety engineering – deserves a spot in the IT problem manager’s toolkit for preventing repeat incidents and improving system reliability.
Origin and Evolution of Fault Tree Analysis
Fault Tree Analysis was born out of necessity in the high-stakes world of Cold War technology. Fault Tree Analysis (FTA) was first developed in 1962 by H. A. Watson at Bell Laboratories as part of a U.S. Air Force safety study for the Minuteman missile program, and was later adopted widely in aerospace and nuclear safety engineering (Vesely, Goldberg, Roberts, & Haasl, 1981; IEC, 2006). The method provided a way to analyze how complex systems could fail by mapping out the chain of events leading to an undesired state (the “fault”). The approach quickly proved its worth. By 1965, Boeing engineers had incorporated FTA into system-safety practice and presented it at the first System Safety Symposium in Seattle, where it was recognized as a foundational reliability-engineering method (Vesely et al., 1981; Ericson, 2015). Boeing later applied FTA to the design of its commercial aircraft, using fault trees to anticipate and mitigate failure modes throughout critical systems (Vesely et al., 1981; Ericson, 2015).
Following its introduction, FTA spread rapidly to high-reliability industries such as aerospace, nuclear energy, and chemical manufacturing due to its ability to model complex causal dependencies (NASA, 2011; Ericson, 2015). Government and industry standards began to incorporate FTA for risk assessments; for example, the U.S. Federal Aviation Administration required systematic hazard analyses (including fault trees) for critical systems after the 1970s. NASA subsequently recognized the value of FTA – particularly after the Challenger disaster emphasized the need for rigorous probabilistic risk assessment of complex systems (NASA, 2011; Ericson, 2015).
By the 21st century, FTA’s use had expanded beyond engineering hardware. Software and IT system failures, with their many interdependent components, proved to be well-suited to fault tree modeling. Notably, the latest ITIL (Information Technology Infrastructure Library) guidance for ITSM explicitly cites Fault Tree Analysis as a recommended root cause analysis technique, alongside approaches like 5 Whys (InvGate, n.d.). In other words, FTA has come full circle: from safeguarding missiles and aircraft in the 1960s to helping IT organizations in the 2020s ensure the reliability of digital services. The evolution highlights a core truth: whether it’s a hardware fault or an IT outage, complex problems benefit from a structured, analytical approach to find their cause.
Theoretical Foundations of FTA
At its core, Fault Tree Analysis is based on deductive logic and boolean algebra. It employs a top-down approach: you start with an undesired event (the “top event” – e.g., a system outage or failure) and deduce the possible causes of that event, then the causes of those causes, and so on. The relationships are represented using logic gates (primarily OR and AND gates) that reflect how events combine. An OR gate means any one of the input causes can lead to the output event, whereas an AND gate means all input causes must occur together to produce the output. By structuring causes in this way, an FTA diagram visually and logically models all the pathways to failure in a system (The Decision Lab, n.d.). As one reliability expert put it, FTA essentially “translates the failure behavior of a system into a visual logic model” – a simple set of symbols and rules that can capture very complex interactions (The Decision Lab, n.d.).
This logical rigor is what makes FTA so powerful. Unlike a purely inductive approach (like brainstorming causes or using a fishbone diagram), FTA forces analysts to consider how multiple events could interact to cause a problem. It has been touted as “one of the best methods for systematically identifying and graphically displaying the many ways something can go wrong.” (Vesely et al., 1981) In other words, FTA provides both a systematic process and a visual representation for failure analysis. The tree structure not only lists potential causes, but also shows the combinations of causes that can lead to the top event, which is crucial in systems where no single factor causes failure by itself.
FTA’s theoretical foundation also extends to probability theory. A fault tree can be analyzed qualitatively (to find root causes and combinations of causes) or quantitatively by attaching probabilities to base events. If statistical data is available for the likelihood of each basic cause (e.g., a server’s annual failure rate or the probability of a power outage), one can calculate the probability of the top event by propagating probabilities through the logic gates. For instance, if two independent failures both must happen to cause an outage (an AND gate situation), the probability of the outage is the product of their probabilities (since both events coinciding is rarer). If either of two failures could cause the outage on its own (an OR gate), the probability of the outage is closer to the sum of their probabilities (minus any overlap) (ITSM Solutions, 2013). In practice, precise computations can get complex for large trees, but software tools can handle it. The result of quantitative FTA is often an estimate of the top event’s probability and identification of the most critical risk contributors. Analysts also determine minimal cut sets – the smallest unique combinations of basic events that, if they occur together, will cause the top event; these are essential for identifying dominant risk contributors (Vesely et al., 1981; NASA, 2011). (For example, a minimal cut set might be “Power grid failure AND backup generator failure,” indicating those two together will bring down the system.) These concepts allow FTA to play a role in Probabilistic Risk Assessment (PRA), answering questions like “What’s the chance of a total system outage, and what factors dominate that risk?”
In summary, the theory behind FTA merges logic and probability: it uses Boolean logic to map cause-effect relationships and (optionally) probability mathematics to gauge risk levels. This combination provides a deep understanding of not just how a system can fail, but how likely it is to fail in those ways. Little wonder that fault trees are a cornerstone of many safety standards and reliability engineering analyses. The good news for ITSM practitioners is that you don’t need an advanced math degree or missile defense project to apply these ideas – the FTA method can be employed with basic reasoning and, as we’ll see, a clear step-by-step process.
FTA Methodology: How to Build a Fault Tree
Conducting a Fault Tree Analysis involves constructing a diagram that maps out the cause-and-effect logic leading to the top event (the problem). The process is methodical and can be broken down into clear steps. Below, we’ll walk through the step-by-step methodology of FTA, using IT-related context for illustration. (In practice, one might do this on a whiteboard, in a spreadsheet, or with specialized software – but the thought process is what matters most.)
1. Define the Top Event (Problem)
Begin by explicitly defining the problem or failure you want to analyze – this is the top event of the fault tree. It should be a specific, observable undesired outcome. In IT terms, it might be “Email service down for more than 4 hours” (ITSM Solutions, 2013) or “Users unable to authenticate to system XYZ”. Being specific is important; it sets a clear scope for the analysis. Top events can be drawn from real incidents (e.g., a major outage that occurred) or hypothetical scenarios (“what if the data center goes offline?” for risk assessment). For example, if you’re concerned about a critical application’s availability, your top event might be “Complete outage of Application ABC.”
2. Identify Immediate Faults (First-Level Causes)
Next, identify the major fault events that could directly lead to the top event. These are the first level of causes under the top event in the tree. Ask, “What could cause this top event to happen?” In many cases, especially in IT, you’ll find multiple broad categories of causes. For instance, continuing the email service outage example, two plausible first-level faults might be “loss of power to the email server” and “hardware failure of the email server.” (ITSM Solutions, 2013) Each of these is a significant fault that, on its own, could bring down the service. List all such faults you can think of, based on data and experience (brainstorm with your team, review incident logs, etc.). Draw the top event at the top of your diagram, then draw lines down to each of these fault events (often represented in boxes). At this stage, we’re not worrying about logic gates – just enumerating what major things could go wrong.
3. Drill Down into Causes
For each fault event identified in step 2, analyze why that fault could occur. In other words, treat each fault as a sub-problem: what are the possible causes of that fault? These become the next level of events in the tree, connected below their respective fault. For example, if one fault is “loss of power”, you might break that down into causes like “commercial power grid outage”, “UPS (battery backup) failure”, or “generator malfunction.” (ITSM Solutions, 2013) If another fault is “server hardware failure”, causes might include “disk array failure”, “CPU/motherboard failure”, etc. At this stage, you are effectively performing mini-FTAs on each branch. Add each cause as a new node under the fault it can produce, and connect them. This process continues iteratively: for each cause you add, consider if it in turn has underlying causes. In an FTA, causes at the lowest level (with no further sub-causes worth analyzing) are called basic events or root causes. Stop drilling down either when you’ve reached a cause that is fundamental enough to be treated as “root” (for example, human error, or a component fully broken) or when it’s not practical to break it down further. In an IT context, a root cause might be something like “Memory leak in service process due to code bug” or “Generator out of fuel” – actionable specifics.
4. Apply Logic Gates (AND/OR)
Here is the key to fault tree analysis: as you map causes, determine the logical relationship among them for each higher-level event. Insert gates (AND or OR) to reflect whether all the sub-events are required or if any one of them suffices to cause the event above. By default, if you list multiple independent causes for a fault, you’ll use an OR gate: any one of those causes can lead to the fault. In our email outage example, the service could be knocked out by loss of power OR by a hardware fault – either one alone is sufficient (ITSM Solutions, 2013). So, beneath “Email service down” we would place an OR gate, branching to “Power loss” and “Hardware failure.” On the other hand, use an AND gate when an event will occur only if multiple conditions happen together. For instance, “loss of building power” AND “battery backup exhausted” might both be required to cause the “loss of power” fault for our email server (ITSM Solutions, 2013). In that case, you’d draw an AND gate below “Loss of power,” with branches to “Commercial power outage” and “Backup power failure,” indicating both must occur for power to be lost. Every level of the tree should be evaluated this way. The diagram starts taking shape as a series of logic gate nodes with branches to causes (typically drawn with the gate symbol below the higher event). This step may also prompt you to think of additional combinations you hadn’t initially considered. (Note: FTA convention uses specific symbols for AND, OR, etc., but the concept is what’s important; even a label “AND” or “OR” on a chart can suffice).
For example, consider a scenario with a web service outage that had two contributing issues: a load balancer misconfiguration and a database failure. If either one could have taken down the service independently, we’d model the service outage with an OR gate to those two causes. But if both had to happen simultaneously (perhaps the system would have coped with one issue but not the combination), we’d use an AND gate. FTA’s use of gates thus captures the logic of failure: it shows whether causes are alternative or conjunctive. This is a major advantage over linear methods – it helps you recognize when a disaster was actually the result of an unlikely combination of events versus a single point of failure.
5. Continue Until Root Causes Are Identified
Keep expanding the tree downward, applying the same logic, until you reach root cause events that you consider “actionable” or atomic. A root cause in FTA is typically a basic initiating event that either cannot be broken down further or that you decide is beyond the scope to analyze (for instance, “power grid fails” might be a root cause for your data center – you’re unlikely to break down why the grid failed, as it’s outside your system). In IT problem management, root causes are often things like a specific failed component, a coding error, an external dependency failure, or a human error. A good rule of thumb is to drill down until the causes are specific enough that you can think of a definitive corrective action for each (ITSM Solutions, 2013). For example, “Backup generator fuel tank empty” is specific and actionable (refuel it and improve fuel monitoring), whereas a higher-level node like “Backup generator failed” is not as actionable without digging deeper. Make sure each branch of the tree ends in these basic events. At this point, the fault tree diagram is essentially complete, illustrating all the traced paths from various basic events up through intermediate faults and gates to the top event.
6. Identify and Implement Countermeasures
This step goes beyond analysis into solutioning, but it’s an integral part of using FTA in practice (especially in ITSM, where the goal is to prevent recurrence). For each root cause identified in the tree, brainstorm and note countermeasures or fixes. In fault tree diagrams, one might annotate or list these countermeasures below the basic events (perhaps in a different color or shape). For instance, if a root cause of “power supply filter clogged” was identified for a server failure, a countermeasure might be “Implement monthly cleaning of power supply filters.” (ITSM Solutions, 2013) If an expired SSL certificate caused an outage, a countermeasure could be “Enhance monitoring and auto-renewal for certificates.” The idea is to directly address each basic cause so that path to failure is mitigated or eliminated. Connect each countermeasure to its root cause event (in a formal FTA diagram, these might be noted as “inhibitor” events or simply documented alongside the tree). By doing this, you transform the fault tree from a static analysis of what went wrong into a forward-looking plan for improvement. When you’re done, you now have not only a visual map of how the incident can occur, but also a set of action items to prevent future occurrences.
After completing these steps, step back and review the fault tree. You should have a comprehensive diagram of the incident’s causal logic. Fault trees show exactly how an event can occur and what conditions combine to produce it. This clarity is incredibly useful. It not only helps in finding the true root causes (perhaps buried under layers of contributing factors), but also guides you on where to intervene. Often, the very act of constructing the fault tree will spark insights – team members may suddenly see a connection they hadn’t before, or realize an assumption was wrong. In fact, practitioners note that simply creating a fault tree often generates excellent ideas and possible solutions where before there were none (ITSM Solutions, 2013).
7. Quantify the Analysis (Optional)
If you have data on how often each basic event happens (or what its probability is during a given timeframe), you can augment the fault tree with a quantitative analysis. This involves assigning probabilities (or frequency rates) to the lowest-level events and then calculating the probability of higher-level events via the logic gates. As mentioned earlier, in quantitative analysis, the probability of a top event is calculated by propagating basic-event probabilities through logical gates—multiplying for AND combinations and summing for OR conditions (Vesely et al., 1981; NASA, 2011). For example, if Power Grid Failure has a 5% annual probability and Generator Failure has a 1% probability in the same period, an AND gate would give the combined event (total power loss) a 0.05 * 0.01 = 0.0005 (0.05% annual probability) – quite low, reflecting the unlikely coincidence. These calculations can get more complex if there are many events (and non-independence, etc.), but software can handle it. The result is a risk profile for the top event. You might discover, for instance, that the probability of the top event is dominated by one particular chain of events, helping you prioritize which fixes will most reduce risk. Quantifying FTA turns it into a probabilistic risk model. However, even if you don’t quantify, a qualitative fault tree is immensely valuable – you’ve already taken a huge step toward preventing problems or solving tough incidents by mapping them out (ITSM Solutions, 2013). Quantification is the “icing on the cake” when data is available.
FTA Methodology Recap
To recap FTA methodology: Define the problem, break it down into causes, use AND/OR logic to structure those causes, iterate until you reach root causes, then address those causes. The outcome is a logically rigorous cause map of the incident. In an ITSM context, this methodology might sound time-consuming compared to a quick brainstorming session, but it pays off by ensuring no significant factor is overlooked. Next, let’s see how this method applies to some common IT scenarios.
Applying Fault Tree Analysis in ITSM: Use Cases and Scenarios
Modern IT systems are complex, with many interconnected components and layers of technology. As a result, major incidents in IT (like a service outage) often have multiple contributing factors rather than one single obvious cause. Fault Tree Analysis is particularly useful in this context – it helps IT teams dissect incidents systematically and pinpoint how various factors combined to produce a failure (Atlassian, n.d.). Let’s discuss a few use cases in IT Service Management (ITSM) where FTA can be valuable, and walk through example scenarios to illustrate how an IT professional might build a fault tree for each.
FTA can be applied in both reactive and proactive ways within ITSM:
- Reactive Problem Analysis: After a major incident or recurring issue, to determine the root cause(s) and prevent recurrence (as part of Problem Management per ITIL). FTA shines in post-incident reviews where the causes are not immediately clear or are suspected to be manifold. In fact, it’s often used to find the root cause of major incidents in IT (Atlassian, n.d.).
- Proactive Risk Analysis: Before changes or as part of continuity planning, to foresee how a combination of failures could lead to an incident. By constructing a “what-if” fault tree for a potential outage, you can identify weaknesses in the design and address them before any incident occurs. (Atlassian’s incident management glossary notes that FTA can “predict what events might lead to incidents in the future” (Atlassian, n.d.) – this is that proactive aspect.)
Below, we explore two scenarios: one infrastructure-level failure and one application-level failure. These examples will demonstrate how FTA is applied and how the resulting fault tree provides insight.
Example 1: Fault Tree for a Data Center Outage (Service Outage & Cascading Failures)
Scenario: Imagine your company’s primary data center experienced a total outage last week – all services went down for several minutes. Upon investigation, you find that the data center lost power unexpectedly, and the backup systems didn’t hold. This is a classic high-impact failure that usually has multiple layers (in resilient facilities, no single failure should take everything down). We’ll use FTA to analyze how a data center outage like this could happen, uncovering the cascading failures behind it.
Top Event: “Complete Data Center Outage”. This describes the outcome we want to analyze – the loss of all IT services in the data center.
First-Level Faults: Start by identifying the broad faults that would directly cause a data center-wide outage. Two obvious candidates are:
- Power Supply Failure to the Facility – if the entire data center loses power, all systems will shut down.
- Network Connectivity Failure – if the data center’s network connections to the outside world are completely cut, it may appear as an outage to users (even if systems are running, no one can reach them).
These two faults cover the major infrastructure domains (power and network) that could bring everything down. We place an OR gate under the top event, leading to these two fault events: “Total Power Loss” OR “Total Network Loss” could individually result in the same top-level outcome (data center offline).
Now, let’s break each down:
Branch 1 – Power Failure (Total Power Loss): In a well-designed data center, there are redundant power measures. So a total power failure likely means multiple failures occurred in sequence:
- The utility grid power went offline (e.g., a city-wide blackout or a feeder line failure), AND
- The backup power systems failed to sustain the load.
Usually, backup power involves an Uninterruptible Power Supply (UPS) for short-term battery power and diesel generators for longer-term power. So under “Total Power Loss,” we might use an AND gate to represent “Utility Power Out” AND “Backup Power System Failed.” Under those, we can get more specific:
- Utility Power Out could be due to a grid failure, a transformer blowout, etc. (We might treat it as a basic event for this analysis, or break it down if we have data. Typically, IT teams accept “grid failure” as an external root cause.)
- Backup Power System Failed could result from several causes: Generator Failed to Start, UPS Battery Depleted, or even Transfer Switch Failure (the device that switches load to the generator). We would list all plausible causes here under an OR gate for “Backup Power Failure.”
Let’s say, in this incident, we discover the diesel generator did start, but shut down after a short time because the fuel was nearly exhausted, and the UPS batteries only had a few minutes of charge. That path can be represented as: “Generator shuts down due to low fuel” AND “Utility outage lasts longer than UPS battery autonomy” – both together leading to backup power running out. The fault tree branch for power would show how a commercial power outage combined with insufficient fuel in the generator (a preventable maintenance issue) led to complete power failure. The root causes here might be “Fuel tank not refilled (human/process error)” and “Prolonged utility outage”. The fault tree diagram thus captures a cascading failure: one event (grid down) triggered reliance on backup, which then failed due to another event (no fuel) – both had to happen to cause the total downtime.
In the diagram, it would look like: Top Event “Data Center Outage” – OR –> “Power Loss” – AND –> (Grid Power Off AND Generator Failed) – where Generator Failed might further be an AND of “Fuel empty” AND “Extended outage (battery depleted)”, etc. Each of those basic events could be analyzed or assigned responsibility (e.g., why was fuel empty?). See Figure 1 below.
Branch 2 – Network Failure: The data center could be humming along with power and servers, but if it becomes cut off from the network, users will experience an outage. High-availability designs often have redundant network links (multiple ISPs or fiber paths). So a total network isolation likely also involves an AND of failures:
- The Primary Network Link went down (e.g., fiber cut, router failure),
- The Secondary/Redundant Link simultaneously went down (perhaps due to a separate incident, or it was already in a failed state unknown to the team).
Under “Total Network Loss,” we put an AND gate with causes like “Primary WAN link down” AND “Backup WAN link down.” Each of those could have sub-causes. For instance: - Primary link down could be caused by “Construction cut the fiber cable” or “Core router hardware fault.” - Secondary link down might be “Misconfiguration – traffic not failing over” or “Secondary ISP outage.”
In our scenario, suppose it turned out that a fiber cut on the primary line occurred, and at the same time, the secondary line was down because a router module had been out of service (and the failover had not been properly tested). The fault tree exposes that the network outage wasn’t a single event but a combination: a physical failure plus a latent configuration issue. On the diagram: “Network Loss” – AND –> (Primary Fiber Cut AND Secondary Router Misconfigured). The root causes might boil down to “Fiber cut by construction crew” and “Change management lapse – backup router config error”. Each can then be addressed (work with ISP on fiber routing diversity, fix the config, and improve change controls).
Fault Tree Outcome for the Data Center Outage: By mapping the above, our fault tree would illustrate two main branches (power, network), each with their own detailed sub-branches of failure. In reality, a data center could also go down from other factors (e.g., cooling failure leading to thermal shutdown of systems, or a massive fire). We could incorporate those as separate first-level faults as well (e.g., an OR branch for “Infrastructure Environment Failure”). For brevity, we focused on power and network, which are common causes.
Through FTA, the IT team gains a clear picture of how a supposedly resilient data center still went offline: it required a chain of failures that defeated both primary and backup systems. This insight is incredibly useful for planning improvements. The analysis might highlight, for example, that fuel levels should be monitored more closely and that network failover configurations should be regularly tested. These become actionable learnings. In a real post-mortem report, one could include the fault tree diagram to visually communicate the incident’s complexity to stakeholders.
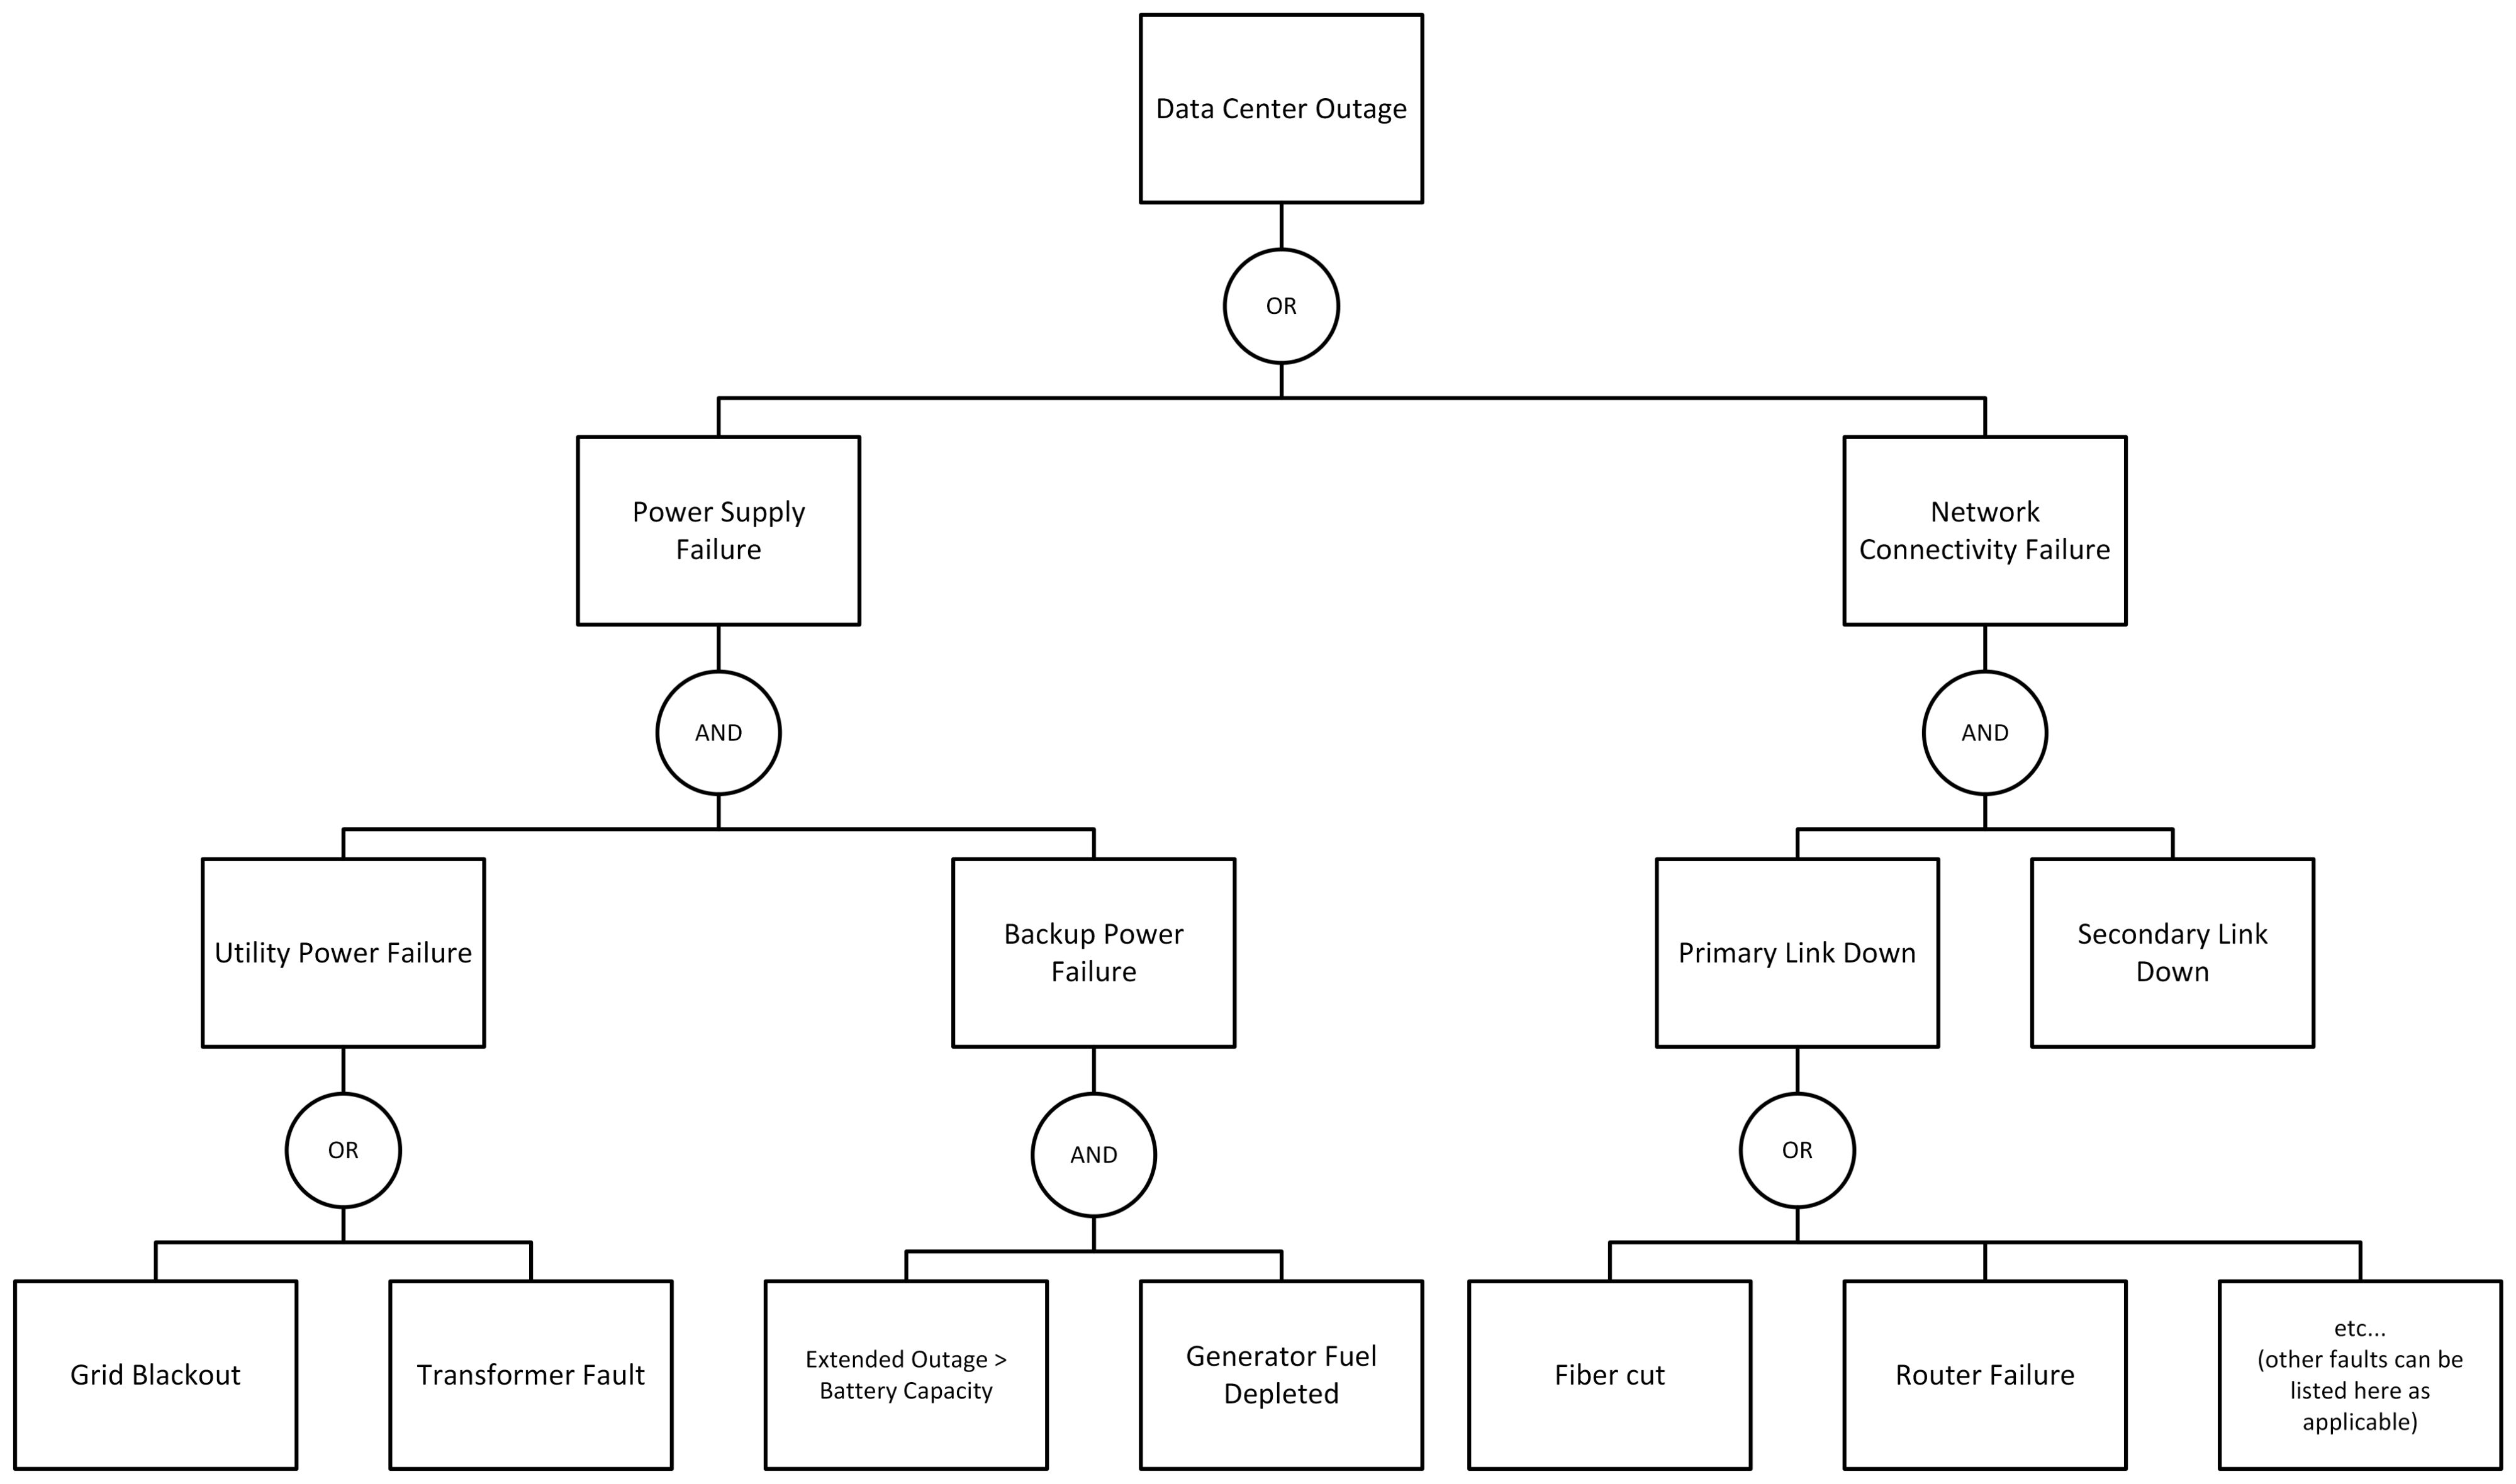
Figure 1. Sample Fault tree diagram illustrating causes of a data center outage (Example 1) using generic shapes.
Analysis: This example highlights a cascading failure pattern – multiple things went wrong in different subsystems (power, network), and only together did they result in the big outage. Fault Tree Analysis was instrumental in revealing this. A simple linear analysis might have blamed the power outage alone or the fiber cut alone, but FTA forces us to see that redundancies failed; thus, the true “root cause” is as much about the backup failures as the primary triggers. In ITSM terms, this informs both Problem Management (root causes: e.g., “fuel refill process failed”) and Continual Improvement (recommendation: e.g., “add automated fuel level alerts, simulate network failover quarterly”). FTA not only answers what happened, but also helps answer how to prevent it from happening again on a systemic level.
Example 2: Fault Tree for an Authentication Service Failure (Application/Change Failure)
Scenario: Your company’s single sign-on Authentication Service (which handles logins for users) experienced a severe outage: for two hours, no users could log in to any applications. This happened right after a scheduled update was applied to the auth service. The incident was resolved by rolling back the update and renewing a configuration, but we want to perform an FTA to uncover all underlying causes. This scenario is typical of a failed change causing an incident, potentially compounded by other factors (like a backup system not working). We’ll see how FTA can capture both the change-induced error and any other hidden issues.
Top Event: “Users unable to authenticate (login failure) across all systems.” This defines the outage outcome we analyze.
First-Level Faults: Ask, what could immediately cause a system-wide auth failure? Two broad possibilities come to mind:
- The authentication service itself failed. (If the auth server/process is down or not functioning, logins will fail.)
- There’s a network or connectivity issue preventing communication with the auth service. (For example, perhaps users’ login requests aren’t reaching the service, or the service can’t reach its user database.)
These are qualitatively different causes (one is an application failure, the other is an external barrier), and either one could cause the symptom, so we put an OR gate under the top event linking to:
- Authentication Service Failure (the service isn’t operating correctly),
- Authentication Request Flow Failure (something in the network or request path is broken).
Now, let’s break each:
Branch 1 – Authentication Service Failure: We know a new software update was applied, which is a strong suspect. There could also be other reasons the service failed (unrelated to the update). Possible causes under this node:
- Software Bug or Crash in the Auth Service
- e.g., the new update had a critical bug causing the process to crash or hang.
- Configuration Error
- e.g., a misconfiguration in the authentication server (perhaps introduced by the update) made it non-functional.
- Expired Security Credentials
- e.g., the authentication server’s certificate or keys expired, causing all login attempts to be rejected (this might coincidentally happen around the update time or be triggered by it).
- Dependency Failure
- e.g., the service couldn’t connect to the user directory (database/LDAP) because that endpoint was down or credentials changed.
Suppose in this incident it turns out that the update introduced a bad configuration: a certificate was not updated properly, leading the auth service to reject all login requests. In essence, a certificate expiration issue manifested immediately after deployment. So one root cause was “SSL certificate expired on auth server, causing failures.” However, you also discover something else: there was a redundant secondary authentication server that should have taken over, but it didn’t because it was misconfigured and never actually joined the cluster properly. This means the outage could have been avoided if the failover worked. So we have another aspect: Secondary Auth Server Failover Failed – which itself might be due to a configuration oversight (e.g., the secondary had the same expired certificate or wasn’t updated at all and got out of sync).
We realize that two things had to go wrong: the primary auth service broke (due to the cert issue) and the secondary did not pick up the load. This is an AND relationship contributing to the “Auth service failure” at a system level, since the authentication service (as a whole) is considered failed only if both primary and backup are unavailable. If the system were designed to tolerate one node failing, then the outage indicates all nodes failed.
So we might structure this branch with an AND gate: “Primary authentication node failed” AND “Secondary node failed” – leading to total auth service failure. Under Primary node failed, the cause could be the expired certificate (triggered by the update process). Under Secondary node failed, the cause could be “Misconfiguration – secondary never active”. In reality, if the certificate were a common dependency, the secondary might have failed for the same reason (e.g., same expired cert). We can capture that as well. The fault tree helps enumerate these scenarios: perhaps the secondary was up but also had the expired cert (so it was equally non-functional – effectively both nodes had the same single point of failure), or the secondary was misconfigured and not actually in use. Either way, the result is no authentication service available.
So, our diagram for this might show: Auth Service Failure – AND –> (Primary Failed AND Secondary Failed). Primary Failed – due to –> “Expired certificate” (and/or “Software bug” – if the update had a code bug, we could include that, but let’s say it was primarily the cert). Secondary Failed – due to –> “Cluster config error” (not taking over). If the same cert issue affected both, we could represent that as a common cause node feeding into both primary and secondary failures (fault trees can model common-cause events too), but to keep it simple, we’ll list it per node. See Figure 2 below.
Branch 2 – Request Flow/Connectivity Failure: Alternatively, maybe the auth service was running fine, but users still couldn’t authenticate because their requests never got to it, or the responses never got back. Under this, consider causes like:
- Network Issue
- e.g., a firewall or load balancer misconfiguration after the update blocked the authentication traffic. (Sometimes deploying an update can inadvertently change network settings or firewall rules.)
- DNS or Routing Issue
- e.g., the authentication service’s address might have changed, but DNS wasn’t updated, so clients were hitting an old IP.
- Downstream Dependency
- e.g., the auth service needed to talk to a database or external IDP, and that connection was failing.
In our case, let’s say no network issues occurred (the primary issue was within the service itself). We would still document these possibilities in the fault tree if we were being thorough, but when we finalize the analysis, we might mark them as not contributing this time. For demonstration, one could imagine if the firewall was misconfigured and the update had a bug, either could have caused issues – an FTA would capture both, with an OR if either could independently cause the top event, or an AND if both needed to. (Often, network misconfigurations manifest as everyone being unable to reach the service, which looks the same as the service being down.)
For completeness, let’s say we did find a minor network configuration lapse: perhaps a new load balancer config was applied but had an incorrect health check, which declared all auth nodes down. This is actually another contributing factor: the nodes might have been partially available, but the load balancer wasn’t sending traffic to them due to the health check failure. If that occurred, it would be a separate branch (and possibly an AND with the service failure – meaning both the service was unhealthy and the load balancer compounded it). However, to keep from over-complicating, we’ll focus on the primary causes (expired cert + failover misconfig).
Fault Tree Outcome for the Auth Outage: The fault tree analysis reveals that this incident wasn’t just “a bad update” or “ops forgot to renew a certificate.” It shows a dual failure:
1. Direct cause: an expired certificate (a change/configuration issue) took out the primary service.
2. Defense failure: the secondary node that should have provided redundancy was misconfigured (another process issue), so the failure was not isolated.
These might be documented as two root causes: “Certificate expiration not caught (change/release process gap)” and “Redundant server misconfigured (implementation/maintenance gap)”. Each is tied to an actionable fix: implement certificate lifecycle management to prevent expiry, and fix the secondary node configuration + test failover procedures. The fault tree ensures you don’t stop at the first cause (the cert) and overlook the second (redundancy failure). In a sense, it combines a “5 Whys” on multiple branches: Why was service down? Cert expired. Why did the cert expire? Perhaps auto-renewal was misconfigured (could dig deeper if needed). Separately, why didn’t the failover work? Because the secondary was never properly configured. Why not? Maybe because it was never tested after initial deployment, etc. The FTA captures both threads in one view.
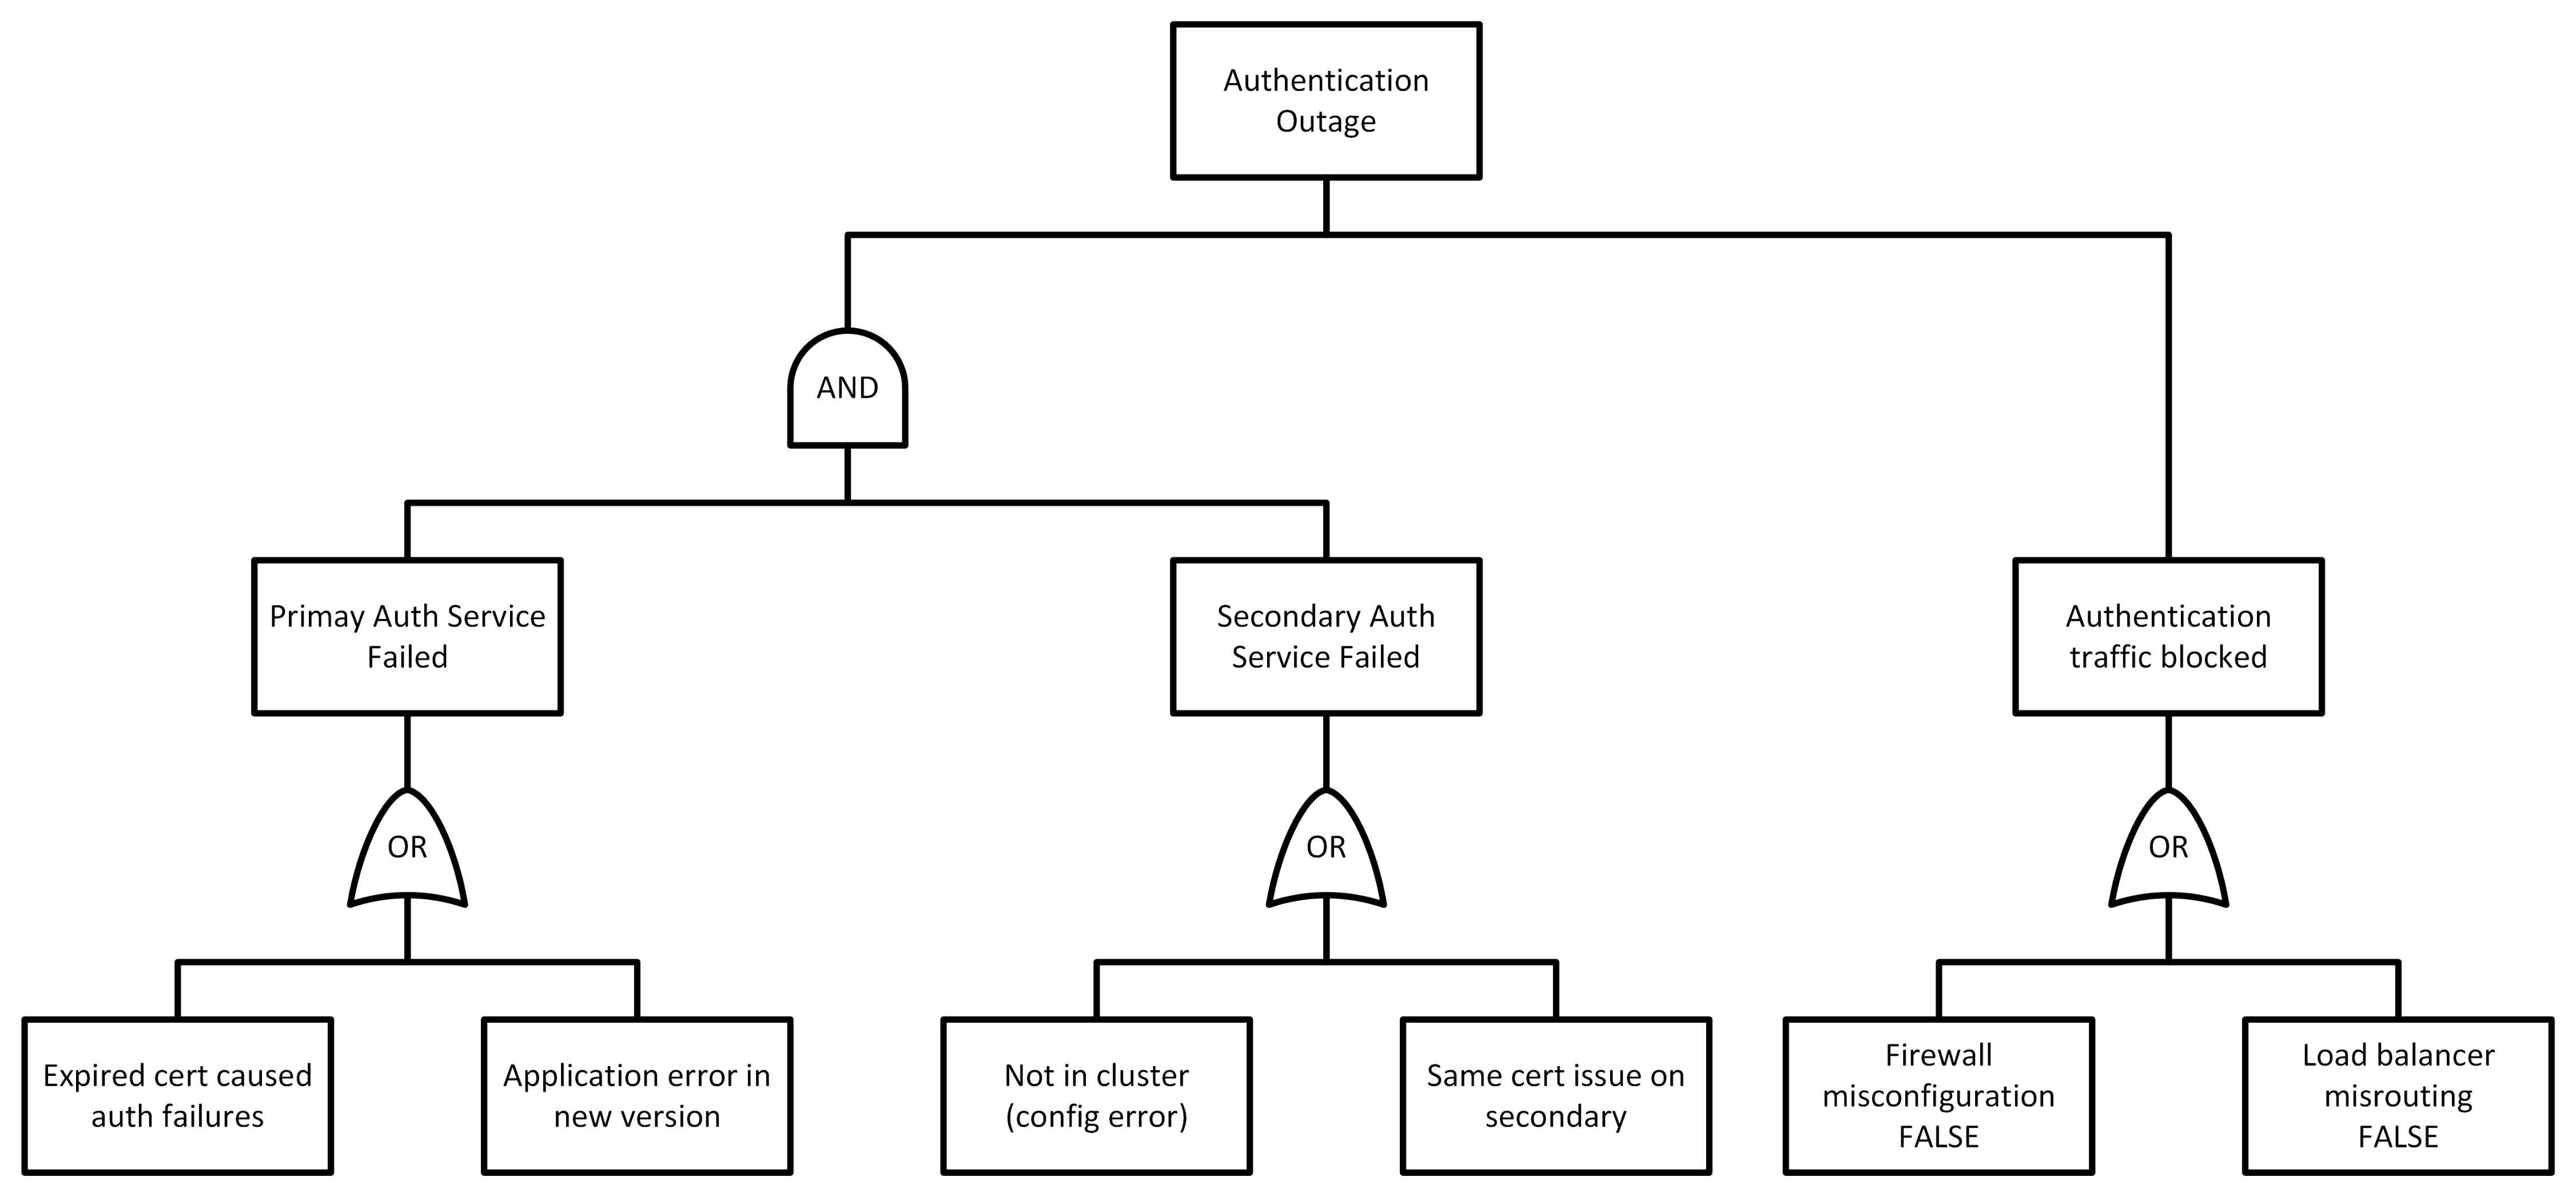
Figure 2. Sample Fault tree diagram illustrating causes of an authentication service outage (Example 2) using FTA notation
Analysis: This example underscores how FTA helps in multi-cause application failures and change-related incidents. In complex IT systems, a deployment might succeed under some conditions and fail under others. Here, the fault tree approach ensured we looked at both the triggering technical fault (an expired certificate from the update) and the latent organizational fault (untested failover setup). By doing so, Problem Management can address both – not just fix the cert, but also shore up the redundancy and perhaps review why the secondary was misconfigured in the first place (training issue? documentation issue?). It’s worth noting that if one were using a simpler method like 5 Whys, one team might have stopped at “Why did it fail? – Certificate expired. Fix: renew it.” Another might say, “Why did users experience an outage? – Because secondary didn’t take over.” If those analyses aren’t connected, you miss the full picture. FTA, on the other hand, connects them in one coherent model.
In practice, IT teams using FTA for such scenarios often find that it improves their post-incident reviews significantly. The visual nature helps communicate to non-technical stakeholders why an incident was complex and not just due to a single “human error” or “bad code” – it shows the interplay of factors. It also provides a checklist of sorts for preventing future issues: each basic cause is a point of failure to be managed (monitor certificates, test failovers, etc.). As IT systems grow more distributed (microservices, multi-cloud, etc.), this ability to map out interactions is increasingly valuable.
Other ITSM Use Cases: The two scenarios above are illustrative, but FTA can be applied to many other situations:
- Chain reactions in Microservices
- e.g., one service failure overloads another (FTA can map how a single service’s outage leads to a cascading microservice outage through fallbacks failing, circuit breakers misconfigured, etc.).
- Change Implementation Failures
- e.g., a patch deployment goes wrong – FTA can capture technical causes (script error, version mismatch) and process causes (insufficient testing, backup failed to rollback).
- Security Incidents/Downtime
- e.g., an outage caused by a cyberattack – FTA could map out how a DDoS attack, plus a firewall misconfiguration, and a capacity issue collectively led to downtime.
- Major Incident Response Failures
- e.g., if incident recovery was delayed because alerts didn’t reach the on-call or a runbook was wrong, an FTA could include human/process failures (like “Monitoring alert missed” AND “Failover script error” contributing to prolonged downtime).
In summary, any time you have a complex incident or problem with multiple potential contributing factors, Fault Tree Analysis is a suitable technique to consider. ITSM teams often use simpler tools for day-to-day issues, but when facing a high-impact, perplexing problem, building a fault tree can provide clarity that other tools might not. It’s no coincidence that ITIL and industry leaders include FTA among recommended practices for problem management of major incidents (InvGate, n.d.).
Comparing FTA with Other Root Cause Analysis Techniques
Fault Tree Analysis is one of several tools in the root cause analysis (RCA) arsenal. IT professionals may also be familiar with methods like the 5 Whys, Ishikawa (Fishbone) diagrams, Failure Mode and Effects Analysis (FMEA), and others. Each technique has its strengths and ideal applications. Let’s compare FTA with some of these common approaches to understand when and why you might choose FTA over others (or use them in combination).
FTA vs. 5 Whys
The “5 Whys” technique involves repeatedly asking “Why?” to drill down a linear cause-and-effect chain. It’s simple and quick – great for straightforward problems that have a single evident chain of causation. For example, if a server went down because a power strip was unplugged, one can ask “Why?” a few times and get to a root cause (human error, no backup power, etc.). However, 5 Whys tends to focus on one path at a time and assumes each cause has one prior cause. It can easily oversimplify complex issues (Reliability, n.d.). If a problem has multiple converging causes, a single line of “whys” might miss some. In fact, ITIL’s guidance warns that 5 Whys is best used on simple or moderately difficult problems and is “likely unsuitable for more complex problems” because it may overlook multiple root causes (InvGate, n.d.). By contrast, Fault Tree Analysis handles complexity better – it allows you to pursue multiple lines of inquiry in parallel. You don’t stop at one cause; you map out many causes and their combinations. For instance, in our data center outage case, 5 Whys might have dug into the power failure or the network failure, but not both systematically. FTA captured both. The trade-off is effort: 5 Whys is quick and anyone can do it on the back of a napkin, whereas FTA requires more thoroughness. A useful approach can be to combine them: use 5 Whys on each branch of a fault tree to further analyze why each basic event occurred (e.g., why was the generator fuel low? Why did the certificate expire?). In summary, use 5 Whys for quick, singular-cause problems, and use FTA when multiple causes or logic combinations are at play. (As a note, 5 Whys can sometimes degenerate into guesswork if one isn’t careful to use evidence at each step; FTA’s structure can help reduce that by requiring logical relationships.)
FTA vs. Fishbone (Ishikawa) Diagrams
Fishbone diagrams (also known as Ishikawa or cause-and-effect diagrams) are a brainstorming tool that visually lays out potential causes of a problem across predefined categories (like People, Process, Technology, Environment, etc.). They are excellent for ensuring a team considers a broad range of possible causes and for organizing ideas. In ITSM, a fishbone might be used in a major incident review meeting to capture input from different teams about what might have gone wrong. The fishbone’s strength is in encouraging lateral thinking – it’s “ideal when multiple contributing factors are suspected,” acting as a structured prompt (Freshworks, n.d.). However, fishbone diagrams do not inherently show logical relationships or timing. They list causes, but they don’t depict whether cause A and cause B together lead to the failure, or if they are alternative causes. There’s no notion of gates/logic; it’s essentially a categorized list. By contrast, FTA does show the logic and dependency – it tells you not just what the causes could be, but how they combine to produce the outcome. For example, a fishbone for an outage might list “Power failure” and “Hardware failure” as two causes on the diagram’s “spines,” but it won’t show that those two had to occur together (or not). FTA would explicitly model that with an AND gate. Another difference: fishbones typically don’t prioritize or quantify causes, whereas FTA can be extended to quantify (and at least forces a discussion of which combinations are plausible vs. negligible). On the other hand, fishbone diagrams are easy to create in a group setting and are very accessible – you can throw one up on a whiteboard in 2 minutes. Many teams start with a fishbone to gather hypotheses, then use that input to build an FTA for deeper analysis. Think of fishbone as a divergent process (expanding the list of causes) and FTA as a convergent process (narrowing down to the logical fault paths and true root causes). In summary, fishbone diagrams are great for brainstorming and categorizing possible causes without much structure, whereas FTA is great for analyzing and validating cause-and-effect structure once you have some candidates. They are not mutually exclusive – in fact, fishbone can feed into an FTA. But if you tried to use a fishbone alone for a very complex problem, you might end up with a messy diagram and no clear sense of how the pieces fit together.
FTA vs. Failure Mode & Effects Analysis (FMEA)
FMEA is a proactive, bottom-up analysis method where you consider each component or step in a process (“failure modes”) and examine what would happen if it fails (“effects”). It’s commonly used in engineering and can be quite labor-intensive – you’re essentially enumerating all possible failures in a system and scoring their impact and likelihood. The goal is to find weaknesses before they occur. Compared to FTA, FMEA is inductive (bottom-up), whereas FTA is deductive (top-down) (Software Engineering Institute, 2021). In practice, FMEA and FTA are somewhat complementary. For an IT example, you might perform an FMEA on a critical application by listing ways each module could fail and what effect that would have (which is great for designing mitigations for each module), whereas an FTA would start with “application down” and figure out which combinations of module failures could cause that (great for understanding system-level failure paths). FMEA is excellent for preventative analysis and often ties into calculating a risk priority number for each potential failure, but it doesn’t easily show interactions between multiple failures – it usually assumes one failure at a time. FTA excels at showing how multiple failures together cause an issue (because of the logic gate structure). If you have a single point of failure, both FMEA and FTA will find it (FMEA will flag that component’s failure mode as high impact; FTA will have that component as a single basic event leading to top event). If you have a scenario where only a combination of things cause a problem, FTA will represent that clearly (AND gate), whereas FMEA would require you to sort of manually note that multiple things failing is the concern. For ITSM use, FMEA might be overkill except for very critical systems or where you have a lot of historical data on component failures. FTA is often more straightforward for analyzing an incident that actually happened. In some cases, organizations use FMEA in design phases and FTA in incident analysis phases. To put it simply: use FMEA to examine each component’s reliability, use FTA to examine system-level reliability and incident causation. (And as an aside: another related technique, Event Tree Analysis, is opposite of FTA – it’s forward-looking from an initiating event to possible outcomes, often used in safety to see what happens after something fails. In IT, that’s less commonly used except perhaps for disaster scenario analysis. FTA remains the go-to for backward-looking root cause analysis.)
FTA vs. Simpler Techniques (Pareto Analysis, etc.)
Other RCA or problem-analysis tools might be used in ITSM, like Pareto analysis (e.g., analyzing incident trends to focus on the most frequent issues), or simply analyzing data for patterns. Pareto charts (the 80/20 rule) can identify the most common causes across many incidents, but they don’t explain the cause-and-effect structure of a single incident. They answer a different question (“which types of incidents happen most?” rather than “how did this incident happen?”). A cause-and-effect matrix or affinity diagrams might help organize factors, but again lack the logical structure of FTA.
In general, Fault Tree Analysis is best when you have a complex, high-consequence problem that warrants exhaustive analysis and where understanding interactions is key (Reliability, n.d.). It may not be necessary for every problem – if a user’s account was locked out because they typed the wrong password five times, you don’t need an FTA! But if you faced a major outage that isn’t easily explained by one thing, FTA is a strong choice. One downside to FTA is that it can be time-consuming to build and hard to update manually if the system changes or new information comes to light (Reliability, n.d.). It also requires a bit of training to use correctly (knowing how to draw the gates, not mixing up necessary vs. sufficient causes, etc.). Tools can mitigate the effort (more on that soon).
Using Techniques Together
It’s worth noting that these techniques are not mutually exclusive. Many organizations use multiple RCA tools in tandem (Reliability, n.d.). A typical approach might be: start with a brainstorming (unguided or fishbone) to list potential causes, use 5 Whys on some immediate symptoms to get quick wins or identify an obvious root cause, and if the issue is still murky or large-scale, convene a deeper FTA exercise to ensure all factors and their relationships are understood. For recurring issues, one might do a Pareto analysis to see which causes are most frequent, then perhaps focus FTA efforts on those areas. The key is to match the tool to the problem. As one guide suggests: 5 Whys for straightforward issues, Fishbone for multi-factor brainstorming, FTA for complex failures requiring detailed mapping (Freshworks, n.d.). Knowing the strengths of each helps you pick the right approach (or combination). Table 1 below summarizes comparisons of these techniques.
Table 1. Summary comparison of RCA techniques.
|
Technique |
Strengths |
Limitations |
|---|---|---|
|
Simple, quick, no special tools. Focuses on one cause chain deeply. Best for: simple or well-isolated problems. (Freshworks, n.d.) |
Tends to oversimplify complex problems (Reliability, n.d.). Can miss multiple converging causes. Relies on asking the right “why” each time (subjective). |
|
|
Fishbone Diagram |
Broad view, encourages brainstorming of many possible causes across categories. Visually organizes ideas. Best for: exploratory discussion when causes are unknown but likely multifactor. |
Does not show logical relationships or timing. No indication of which causes actually occurred or mattered (without additional analysis). Can become cluttered for very complex issues. Static picture (doesn’t easily incorporate evidence). |
|
Fault Tree Analysis |
Rigorous logical structure; handles complex cause combinations and interdependencies. Identifies minimal combinations of events leading to failure. Can be qualitative and quantitative. Best for: high-impact incidents with multiple contributing factors, or where understanding interplay of failures is crucial (Reliability, n.d.). |
More effort and skill required to construct. Needs evidence and validation for each cause (to avoid just guessing). Harder to do in real-time without preparation. Diagrams can be large. Manual updates can be cumbersome if system changes (Reliability, n.d.). |
|
FMEA (Failure Mode & Effects Analysis) |
Systematic and proactive; finds potential failures before they occur. Provides component-level insights and prioritization (via risk scoring). Best for: design phase analysis, complex systems where preventing failure is critical (e.g., infrastructure design). |
Very time-consuming for large systems. Does not easily capture multiple simultaneous failures. Geared toward engineering/manufacturing; in ITSM can be overkill for routine use. Often requires good data on failure rates. |
|
Pareto / Trend Analysis |
Uses historical data to focus on most frequent or impactful problem areas. Best for: identifying which problem to tackle first (e.g., if 50% of incidents come from one subsystem). |
Not a root cause analysis method per se – doesn’t explain single incidents. Needs a sufficient volume of data. Should be coupled with another technique to actually find causes of the chosen problem. |
The main takeaway is that Fault Tree Analysis fills a gap that simpler techniques leave – it handles complexity and interdependence in a way few other RCA tools do. It’s a deductive analytical approach that complements the inductive or heuristic approaches. IT professionals should view these techniques as a toolbox: use the right one for the problem. In a single problem management case, you might even use several: e.g., start with a fishbone to gather clues, zero in on a couple of branches and build an FTA for those to verify cause combinations, and then use 5 Whys to drill into underlying reasons for each basic cause. This layered approach can yield a very robust understanding.
Implementing FTA in ITSM Practice
Knowing the theory and seeing examples is one thing – but how do you actually integrate Fault Tree Analysis into your ITSM processes? Implementing FTA in a practical way involves people, process, and possibly tools. Here are some practical steps and tips for using FTA within modern IT Service Management environments:
1. Identify the Right Problems for FTA
Not every incident warrants a full fault tree analysis. As discussed, focus on high-priority, high-complexity issues – typically major incidents, recurring problems that haven’t been solved by simpler analysis, or scenarios where the root cause is unclear and critical to find. For example, a widespread outage, a security breach, or a chronic performance issue with multiple symptoms are good candidates. If you’re following ITIL’s Problem Management practice, these would be problems that get elevated in priority (e.g., causing significant downtime or risk). Management should understand that FTA takes effort, so it should be reserved for when the payoff is worth it (preventing major future outages, etc.). A good trigger is if an incident’s initial post-incident review yields ambiguous or multiple causes – that’s a sign an FTA could add clarity.
2. Involve the Right People (Cross-Functional Team)
Fault tree sessions should be a team exercise – no single person will have all the knowledge of every facet of a complex system. Involve cross-functional teams in the analysis (Freshworks, n.d.). This means bringing in subject matter experts from various domains relevant to the incident: e.g., infrastructure engineers, application developers, network engineers, database admins, security analysts – whomever can contribute insight on different branches of the fault tree. Diverse perspectives help uncover blind spots (Freshworks, n.d.); one team’s “obvious” cause might be something another team never considered. It’s useful to designate a facilitator (often the Problem Manager or a senior engineer) who leads the discussion and ensures logical consistency in the tree. Everyone should be encouraged to think in terms of “what conditions or events could cause X to fail?” and to back up suggestions with data if possible. Also, ensure a blameless culture during this process – people should feel safe admitting to potential misconfigurations or mistakes (“human error” events often appear in fault trees). Emphasize the goal is learning, not blaming (Freshworks, n.d.).
3. Gather Data and Evidence First
Before diving into drawing the fault tree, collect as much relevant data as possible about the incident. This includes logs, monitoring graphs, incident timelines, change records, etc. These are the clues that will support (or refute) branches in your fault tree. It’s often efficient to assign someone to assemble a timeline of the incident: what happened when, which alerts fired, which systems showed errors, what actions were taken, etc. Also, gather configuration information – for example, how the systems are supposed to behave (network diagrams, failover setups, dependency mappings from the CMDB). Hank Marquis, in Fault Tree Analysis Made Easy, noted that FTA requires nothing more complex than paper, pencil, and an understanding of the service at hand – but you do need accurate configuration information to get the most value (ITSM Solutions, 2013). In practice, this means ensure you have the latest architecture and configuration knowledge on hand. This avoids wasting time in the analysis guessing how things are connected. If something like a CMDB (Configuration Management Database) exists, use it to verify components and relationships involved in the incident.
4. Construct the Fault Tree Collaboratively
When you have the right people and data, start building the tree. This can be done in a meeting room with a whiteboard or flip chart, or using a collaborative diagramming tool on a conference call. Begin at the top event (write it clearly). Then go level by level. Pro-tip: Some teams find it easier to start by brainstorming possible causes (like a mini fishbone) and then organizing them into a fault tree structure. Others prefer to build the tree live: “What are the primary things that could cause this? OK, for cause A, what could cause A?” and so forth. Choose what fits your team’s style. As you add each node, use the evidence to validate if that cause actually happened or is merely potential. Mark things accordingly (you might put a checkmark or color on causes that did occur, versus ideas that were considered but ruled out). Stay factual and avoid jumping to conclusions. If someone says “I think X caused Y,” ask if there’s data to support X. If not, mark it as a hypothesis to be investigated. The fault tree will be most effective when it’s grounded in observed evidence. During construction, ensure the logic is clear: for each gate, ask “Do these child events indeed logically combine to cause the parent?” This keeps the analysis sound. It can help to have one person scribble the diagram while others call out ideas – and rotate if needed. Keep the atmosphere analytical but open – encourage people to voice even unlikely scenarios; sometimes those lead to real findings. And don’t let the meeting devolve into finger-pointing; keep it focused on technical cause and effect. It may be useful to set a time limit for initial construction (say, an hour to draft the tree) and then allow for async refinement if needed.
5. Validate the Fault Tree and Identify Root Causes
Once the team believes the fault tree diagram is complete, validate it. Walk through each branch and see if it matches the known chronology and facts of the incident. This is where you ensure that no logical gaps exist. If something doesn’t quite make sense, refine it. You might need to add a missing event or realize two events were actually concurrent and need an AND gate, etc. When validated, the tree should explain the incident from start to finish. Now, review the basic events (leaf nodes) – these are your candidate root causes. In an IT context, some basic events might be external (e.g., “power grid failure”) and some internal (e.g., “config file missing entry”). Likely, you’ll identify a few that were the true correctable root causes under IT’s control (like the certificate expiry, or a failed change, or a single-code bug, etc.), as well as some that are contextual or contributing (like the storm that knocked out power, which you can’t prevent but maybe can better mitigate). Document these root causes clearly in your Problem Record or report. If multiple root causes are combined, make that clear ( e.g., “Outage was caused by a combination of an expired cert and a failover config error – neither alone would have caused a full outage, but together they did.”). This helps management understand that to prevent recurrence, all those causes must be addressed.
6. Take Corrective Actions
An analysis is only as good as the action that follows. For each root cause (or significant contributing cause) identified, define corrective or preventive actions. This ties back to step 6 of our methodology, where we listed countermeasures. In ITIL terms, once you’ve found a root cause, you often raise a Change (or a set of changes) to fix it – or at least plan out improvements. Using our examples: if the root cause was an expired certificate, the action might be “Implement certificate lifecycle monitoring and auto-renewal.” If a failover config was wrong, action: “Fix config and perform quarterly DR tests.” Ensure these actions are assigned to owners and have target dates. It’s good practice to enter them into whatever tracking system you use (could be the problem ticket, a change request, or a separate improvement register). Track these actions to completion (Freshworks, n.d.). Many ITSM tools allow linking problem records to change records so you can see when fixes are implemented. It’s crucial not to let the analysis report gather dust – the value comes when changes are made to prevent the issue. Also, consider if any monitoring or alerting can be added to catch if the issue starts to recur. In complex systems, you might not eliminate every risk, but you can at least get early warnings.
7. Document the Analysis
Thorough documentation ensures the knowledge gained isn’t lost. Capture the fault tree in a diagram (many teams include it in the problem report or post-incident review document). Write up a narrative of the incident that aligns with the fault tree logic – essentially telling the story of what happened, supported by the diagram. Having the diagram is especially useful for communicating with stakeholders who want to know “how on earth did this happen?” It provides a clear visualization. Additionally, store this documentation in your knowledge base or problem management system for future reference (Freshworks, n.d.). If a similar incident happens again in the future, engineers can look back and see the analysis that was done, saving time. Documenting also helps in post-mortem meetings with management – it shows a rigorous approach was taken. Ensure to include in the documentation: the top event, all identified causes (even those ruled out, perhaps in an appendix), the root causes, and the corrective actions taken. This becomes part of your organization’s knowledge growth – every RCA is a lesson learned that makes the team smarter (Freshworks, n.d.).
8. Integrate FTA into the Problem Management Process
To make FTA sustainable, incorporate it into your process workflow. For example, you might add a step in your Major Incident Review template: “Consider using Fault Tree Analysis if the incident has multiple contributing factors or an unclear root cause.” Define criteria for when the problem management team should launch an FTA exercise (e.g., “if initial analysis yields more than 2 possible root causes or if a major incident’s cause is not found within 48 hours, then perform FTA”). It may also help to train a few team members as FTA facilitators or champions. This doesn’t require heavy investment – even a half-day internal workshop to practice FTA on some past incidents can build confidence. As SolarWinds suggests in their best practices, you should train staff on investigative and causal analysis techniques to build internal competence (SolarWinds, n.d.). Familiarity with tools like FTA means that when a crisis hits, the team has this method in their toolkit and isn’t scrambling to figure out how to analyze it. Over time, you might create a template or library of fault trees for common services. For example, you could have af generic fault tree for “Website Down” scenarios that is adjusted for each specific incident. This can accelerate analysis, as you’re not starting from scratch each time – you’re leveraging past knowledge (this is analogous to having known error records; think of them as known fault tree patterns).
9. Use Automation and Tools Wisely
We’ll discuss specific tools in the next section, but from a process perspective, know that modern ITSM environments often include tools that can aid analysis. For instance, some incident management platforms can automatically correlate events or visualize causal links (AIOps tools that cluster alerts might be seen as building pieces of a fault tree automatically). If you have monitoring systems that trace transaction flows, they might identify points of failure that feed into your analysis. While you can’t fully automate FTA (it requires human reasoning), you can automate data collection and even some hypothesis generation. Some advanced RCA software can integrate with your monitoring and change data to help populate fault trees. Keep an eye on those capabilities – if your organization is large and incidents are costly, investing in such tools or modules can pay off by speeding up root cause identification. On a simpler level, even having a standard diagramming tool integrated with your incident system (so you can easily create and attach a fault tree diagram) can smooth the process.
10. Learn and Iterate
Finally, treat the implementation of FTA itself as a learning process. After your team conducts a fault tree analysis, do a quick retrospective on that process. Did it find causes effectively? Was everyone engaged? Did it take too long? Use that feedback to streamline future analyses. Perhaps you’ll discover that you can develop a quick-reference of common logic gate patterns (like “power outage scenarios” template). Or maybe you find that involving a particular domain expert earlier would have saved time. Continuously improve the practice of RCA in your organization. By doing so, you develop a culture of thorough problem-solving. As Freshworks notes, creating a culture of continuous improvement and treating RCA as a learning opportunity (not a blame game) is key to long-term ITSM success (Freshworks, n.d.). When team members see that a methodical approach like FTA leads to real fixes and prevents future pain, they become more proactive in identifying issues and more open to participating in such analyses. Over time, you might even find your team thinking in fault-tree terms preemptively (“if we make this change, what else needs to fail for it to cause a big problem?”), which is essentially a reliability engineering mindset entering daily IT operations.
In essence, implementing FTA in ITSM is about institutionalizing a disciplined approach to complex problem solving. It does require some upfront time and training, but the returns are significant: fewer recurring incidents, faster diagnosis of incidents when they do happen, and a deeper understanding of your systems. Many IT managers find that after doing a couple of fault trees, the team starts naturally approaching problems more systematically. It’s like honing a muscle – the more you practice structured analysis, the more it becomes second nature.
Before closing, let’s touch on tools that can assist with FTA, since using the right tool can make the process smoother and the results easier to share.
Tools and Software for Fault Tree Analysis
You can perform Fault Tree Analysis with the simplest of tools – pen and paper or a whiteboard, as traditionally done by engineers in the 1960s. In fact, as one expert quipped, “FTA requires nothing more complex than paper, pencil, and an understanding of the service at hand.” (ITSM Solutions, 2013) That said, modern software can significantly ease the creation, visualization, and revision of fault trees, as well as calculations if you’re doing quantitative analysis. Here we’ll outline some tool options, ranging from general-purpose diagramming tools to specialized FTA software, and even ITSM-integrated solutions.
1. Diagramming and Drawing Tools
Many teams start with the familiar options:
- Microsoft Visio:
- Visio has a built-in template for fault tree analysis diagrams (in Visio 2019 or Visio Online, you can find “Fault Tree Analysis Diagram” in the Business diagram templates) (Microsoft Support, n.d.). This provides standard shapes for events (like rectangles for events, circles for basic events) and gates (AND, OR symbols) which you can drag and drop. Visio is handy if your organization already uses it; you can make professional-looking fault tree charts and embed them in reports. The downside is that Visio is mostly manual – you’re dragging shapes around. It won’t calculate probabilities for you or check your logic.
- Lucidchart, Draw.io, or other online diagram tools:
- These can be used similarly. In Lucidchart, for example, you might not have a pre-defined fault tree template (unless you import one), but you can create your own shapes or use basic flowchart symbols to represent gates and events. The advantage of online tools is easy collaboration – multiple team members can build or comment on the diagram in real time. Some, like Lucidchart, have community templates for fault trees as well (Lucidchart, n.d.). - Whiteboarding apps (Miro, Mural, etc.): If you prefer a more freeform collaborative approach, digital whiteboards allow teams to sketch fault trees during meetings. You lose some of the precise notation but gain ease of use. You can always formalize the diagram later.
- PowerPoint or pen and paper:
- Let’s not forget, you can even use PowerPoint SmartArt or simple shapes to make a fault tree in a pinch, or draw it by hand and snap a picture. The key is capturing the logic; the medium can be whatever is accessible.
These general tools are perfectly fine for qualitative FTA where you just need the diagram. They are not going to perform reliability math or automatically update anything, but they get the job done for documentation. One tip: if using them often, create a stencil or shape library for fault tree symbols to save time.
2. ITSM and RCA Software
There’s a growing category of software aimed at Root Cause Analysis and problem management that includes support for logic trees (which is essentially what fault trees are).
For example:
- EasyRCA:
- This is an RCA tool that specifically mentions combining methods like Fishbone, 5 Whys, and logic trees in one platform. It allows teams to collaboratively build cause diagrams, attach evidence, and assign actions – basically a specialized workspace for RCA. According to a reliability engineering article, such software brings structure and trackability: teams can build fishbones or fault trees, collaborate in real time, link causes to corrective actions, and track the whole investigation to closure (Reliability, n.d.). The benefit here is integration: your analysis isn’t living in a separate Visio file on someone’s laptop; it’s in a system where people can comment, update, and managers can see progress. It often ties into the problem ticketing system.
- ServiceNow Problem Management module:
- While ServiceNow (a popular ITSM platform) doesn’t have an “FTA tool” per se out-of-the-box, it provides a Problem record where you can document RCA. Some organizations customize it to include a field or attachment for fault trees. There are even community posts and plugins that allow for cause mapping diagrams in the ticket. For instance, ServiceNow has a visualization called “cause analysis” that can be enabled, though it’s more simplistic than a full FTA.
- Atlassian Jira Service Management:
- Similar to ServiceNow, it doesn’t natively do fault trees, but you could integrate a diagramming app (like draw.io has an Atlassian integration) so that you can embed diagrams into Confluence pages or Jira tickets for problem reviews.
- Other RCA tools:
- There are many (often stemming from industrial reliability). Tools like TapRooT, or Sologic’s Causelink are structured RCA tools (TapRooT and Causelink use cause mapping, which is like a variant of fault trees mixed with 5 whys). These let you build cause diagrams and often come with incident database features. They might be overkill for some IT departments, but larger enterprises or those in regulated industries might use them.
The advantage of dedicated RCA or ITSM-integrated tools is mostly in collaboration, consistency, and tracking. They help ensure the RCA process is documented in a standard way and tied into workflows (so, for example, actions from the FTA can automatically generate tasks in the ITSM tool and be tracked). A potential limitation is cost and learning curve – people have to adopt yet another tool. If your team is small, using Visio and an Excel sheet for actions might work just as well. Scale and repeatability often drive the need for specialized software.
3. Reliability Engineering Software (for Quantitative FTA)
If you want to do the math – calculate failure probabilities, identify cut sets automatically, etc., there are specialized tools like:
- Isograph FaultTree+:
- A well-known commercial tool used in engineering. It allows very detailed fault tree modeling, including different gate types (like “k-out-of-n” gates for voting systems), minimal cut set calculation, importance measures, and so on. It’s powerful but likely more than needed for typical IT use, unless you are doing something like assessing the probability of a data center outage per year with various redundancies (which some large IT orgs might do as part of risk management).
- ReliaSoft (by HBK) BlockSim/FTA:
- ReliaSoft has reliability analysis software which includes fault tree and event tree analysis. Again, heavy-duty and used for hardware reliability a lot.
- OpenFTA:
- An open-source fault tree analysis tool that’s been around a long time. It has a GUI for building trees and can do basic probability calculations. It’s a bit dated, but it’s free.
- EMFTA (Eclipse-based):
- As referenced from Carnegie Mellon’s SEI, EMFTA is an open-source FTA tool integrated with the Eclipse framework (Software Engineering Institute, 2021). It’s designed to work with safety models (AADL models) but can be used standalone. EMFTA lets you build the tree and also analyze it: it can auto-calculate probabilities of events if you supply base probabilities, check consistency, and even generate minimal cut sets (Software Engineering Institute, 2021). For example, EMFTA can output something like “These 3 combinations of errors are sufficient to trigger the root failure, along with their probabilities” (Software Engineering Institute, 2021). Such features can be very handy to systematically pinpoint risk hot-spots in the fault tree, especially for preventative work.
- Web-Based FTA Tools:
- There are web apps specifically for fault tree analysis, such as the one by ALD mentioned as “Free web-based fault tree tool” (FTA Software, n.d.). These allow building a tree in your browser, running calculations, and exporting reports (like lists of minimal cut sets, etc.). The example in the reference offers free usage with OR, AND, k/n gates, and can compute steady-state unavailability or mission time probabilities (FTA Software, n.d.). For an IT use, you could plug in estimates (e.g., probability of power failure, probability of bug in release, etc.) and get a sense of the overall system failure probability. While such exact numbers might be hard to get, even rough estimates can help prioritize (like identifying that 80% of the risk of outage comes from one branch, indicating that’s where mitigation is most needed).
Using these specialized tools makes sense if you intend to conduct quantitative risk analysis or if your environment has to adhere to reliability standards that require it. For day-to-day problem RCA, they might be overkill. However, large IT organizations (think of a cloud service provider worrying about their uptime SLA) do perform quantitative fault tree analyses to guide infrastructure improvements. For instance, a cloud provider might model “Total region outage” via a fault tree and quantify it to decide how much redundancy to add. In such cases, a tool that automatically computes the top event probability given various inputs is invaluable. These tools can also link to reliability databases for hardware, etc., though in IT, data on software failure rates is often not as formal.
4. Integrations and Scripting
If you’re analytically inclined, you can use programming or scripting to support FTA. For example, there are libraries in R and Python for reliability analysis. The Open Reliability project has an R package for fault tree analysis (I recall one called FaultTree in R). This allows defining the fault tree structure in code and computing probabilities or doing sensitivity analysis. While this is beyond what most ITSM folks would do, a data-driven team might automate some analysis. For example, if you have incident statistics, you could attempt to feed them into a model to predict top event frequency. This ventures into the realm of probabilistic risk assessment.
5. Communication and Visualization
After using any tool to produce the fault tree, consider how you’ll communicate it. Often, a simplified graphic is needed for executive audiences. Some tools can export to images or Visio. Even if you hand-draw, you might recreate a cleaner version for reports. Ensure the tool you choose can produce output that’s shareable. If using a whiteboard, for a permanent record, it might be worth translating that into a Visio or documented form afterwards.
6. Summary of Tools and Software
In summary, choose the tooling based on the complexity of your analysis and your collaboration needs:
- For a quick analysis with a small team, a whiteboard or basic drawing might suffice.
- For cross-team collaboration and formal documentation, use a standard diagramming tool like Visio or an online equivalent. Many IT orgs stick with this approach and store the diagrams in SharePoint or a wiki.
- If you want a more integrated and trackable approach, explore RCA software or use your ITSM tool’s problem management features to attach diagrams and track actions. The content from the fault tree (like identified causes and actions) can be recorded in the ticketing system so it doesn’t get lost.
- If you need to perform calculations or want to analyze reliability (e.g., “What’s our estimated annual outage probability given these redundancies?”), then look at specialized FTA tools or libraries, at least for the quantification part. You could design the tree in Visio but then input it into a calculator tool to get numbers.
One important note: regardless of the tool, ensure everyone involved can access and understand it. There’s no point in making a perfect fault tree in a software package that only one engineer knows how to use. It’s often better to have a slightly less fancy diagram that the whole team can engage with, than a complex model locked in a specialist tool. Over time, if FTA becomes a regular practice, you’ll naturally gravitate to more efficient tooling.
Conclusion: Actionable Insights for IT Managers and Problem Managers
Fault Tree Analysis, as we’ve seen, is a deep and disciplined approach to root cause analysis – one that was forged in safety-critical engineering but is highly applicable to the complex world of IT systems. By mirroring the logic of how systems fail, FTA helps IT professionals move beyond treating symptoms and truly understand the anatomy of failures. This comprehensive view is exactly what’s needed in an era where even a minor glitch can cascade into a major outage.
For IT managers and problem managers, the actionable takeaways from using FTA are clear and summarized below:
Invest the Effort in RCA for Major Issues
When faced with a serious incident or a recurring problem that isn’t solved by quick fixes, commit to performing a proper root cause analysis – and consider using Fault Tree Analysis as your guiding technique. The initial effort is rewarded by high confidence in the findings. Rather than jumping to the first plausible cause, FTA forces a thorough examination. This reduces the risk of misdiagnosing the problem and implementing the wrong fixes. As the adage goes, “an ounce of prevention is worth a pound of cure” – the prevention comes from the insights of a good RCA. Management should support giving technical teams the time and resources to do FTA when needed (it’s much cheaper to spend a day on analysis than to have another 6-hour outage next month because the true cause was missed).
Address All Identified Root Causes – Especially Latent Ones
FTA often reveals there’s no single silver bullet – multiple factors may need to be fixed. It provides a map of where to intervene. Ensure that each basic cause in the fault tree is evaluated for remedial action. Some will correspond to immediate technical fixes (replace a faulty component, patch a bug), others might point to process improvements (update procedures, add monitoring, training needs). Do not fall into the trap of fixing one cause and ignoring the others because perhaps one was more embarrassing or costly. For example, if the analysis shows a process issue (e.g., change management failed to catch a misconfig), don’t just fix the tech and ignore the process. Implement changes holistically. This might involve cross-functional effort (ops, dev, facilities, etc.), which is why having those teams involved in the FTA helps – they already understand the why and can be allies in the remediation.
Leverage FTA for Proactive Improvement
While we often discuss FTA in reactive mode, managers can turn it into a proactive tool. Use fault tree modeling during system design or when planning major changes. Ask your teams to hypothesize: “What would it take to bring this system down?” Have them sketch a fault tree of a potential catastrophic failure before it happens. This can expose single points of failure or risky dependencies that haven’t been fully mitigated. It’s essentially a way to do a premortem analysis (instead of postmortem) for critical services. Such foresight can drive investments in redundancy or better monitoring. Public cloud providers, for instance, perform elaborate fault analyses to ensure no single event (or combination of a few events) can take down a whole service – IT managers in enterprises can do scaled-down versions of that for their key services. The Atlassian definition of FTA reminds us it can “predict what events might lead to incidents in the future” (Atlassian, n.d.) – use it that way as a strategic tool, not just a forensic one.
Integrate and Share Knowledge
Make the results of fault tree analyses part of your organizational knowledge base. Over time, you will accumulate a wealth of insight about how your systems fail. This can inform everything from training new team members to choosing architecture improvements. Encourage teams to read past analyses of major incidents (many companies have “Post-Incident Review” meetings – consider occasionally reviewing an old fault tree to see if all recommended actions were implemented and if they held up). Also, include key findings in high-level risk registers if you maintain them. For example, if an FTA reveals that a rarely-used legacy dependency is a linchpin in many scenarios, that should elevate its priority in risk planning. By sharing these analyses, you cultivate a culture that values deep understanding. Team members begin to internalize the mindset, which leads to better day-to-day decision making (they might avoid introducing certain single points of failure because they recall a fault tree where that caused an incident).
Build Analytical Skillsets and Culture
On a people level, train and empower your teams to conduct such analyses. You might identify certain individuals with a knack for this kind of systemic thinking – give them opportunities to lead RCAs. Over time, aim to have multiple people capable of facilitating an FTA, so it’s not reliant on a single “RCA guru.” Encourage an attitude of “let’s make sure we truly understand this problem” rather than just rushing to resolution. In the long run, this saves time; it avoids the scenario of recurring incidents and patchwork fixes. As noted in one ITSM guide, “Why” is at the heart of effective problem management and organizations should equip their people with skills to answer that why systematically (SolarWinds, n.d.). FTA is one of those skills.
Measure and Celebrate the Results
Track metrics that matter: reduction in incident recurrence, improved service uptime, faster time to root cause in incidents (perhaps your MTTR – Mean Time to Resolve – for major incidents improves because the team is more efficient at diagnosis). When a fault tree analysis prevents a future outage or identifies a risk that gets fixed, acknowledge that. This reinforces the value of doing it. It’s often hard to prove a negative (i.e., “because we did FTA, X didn’t happen”), but you can note, for example, that since conducting thorough RCAs on a certain class of incidents, those incidents haven’t happened again. That is a concrete value to the business – downtime avoided, customer satisfaction preserved, etc.
Closing remarks
In closing, Fault Tree Analysis offers IT managers a systematic way to conquer complexity. Modern IT systems sometimes feel like a tangled jungle of interdependencies. FTA is like cutting paths through that jungle with logical machetes – it brings order to chaos by clearly delineating how things are connected and how failures propagate. It complements the agile and fast-moving nature of DevOps with a rigor that ensures robustness. By adopting FTA when appropriate, you’re essentially adopting an engineering mindset for IT operations: don’t just fix the symptom, engineer out the problem.
Remember that implementing FTA doesn’t have to be heavyweight. Start small: the next time you have a puzzling outage, sketch a fault tree on a whiteboard and see how it guides the discussion. Use it alongside your existing incident review processes. You’ll likely find that it drives a deeper discussion and surfaces non-obvious issues. Over time, it can become a natural part of your problem management playbook – not used for every little glitch, but there as a go-to for the thorniest problems.
Finally, perhaps the most actionable insight of all is this: Always learn from failure. Whether you use FTA or another method, what’s important is having a structured approach to learning from incidents. Fault Tree Analysis is one of the best in the business for that, and it equips you to answer management’s toughest questions about outages with confidence and clarity. Instead of “We think it was a fluke,” you’ll be able to say, “Here is exactly what happened, here’s how we’ll prevent it going forward (ITSM Solutions, 2013).” That level of understanding not only prevents future incidents but also builds trust with stakeholders (business leaders, customers, auditors, etc.).
In the complex puzzle of IT service reliability, FTA is a technique that helps ensure all the pieces fit – no loose ends, no unexplained mysteries. Embracing it means you’re committing to root cause excellence. And in an IT landscape where the cost of downtime and failures is ever-growing, that commitment will pay dividends in stability, performance, and peace of mind for both IT and the business it supports.
References
Atlassian. (n.d.). Incident management glossary. Atlassian. https://www.atlassian.com/incident-management/glossary
Ericson, C. A. (2015). Fault tree analysis primer. System Safety Society. https://ntrs.nasa.gov/api/citations/20150019648/downloads/20150019648.pdf
NASA. (2011). Probabilistic risk assessment procedures guide for NASA managers and practitioners (Rev. 3). NASA. https://ntrs.nasa.gov/citations/20110023308
Freshworks. (n.d.). Guide to ITIL root cause analysis (RCA). Freshworks. https://www.freshworks.com/itil/itil-root-cause-analysis/
FTA Software. (n.d.). Fault tree analysis software. FTA Software. https://www.fta-software.com/
IEC. (2006). IEC 61025: Fault tree analysis (FTA). International Electrotechnical Commission. https://webstore.iec.ch/publication/4002
InvGate. (n.d.). 4 problem management root cause analysis techniques explained. InvGate Blog. https://blog.invgate.com/root-cause-analysis-techniques
ITSM Solutions. (2013). DITY: Volume 4, Issue 47 – Root cause analysis in ITSM. ITSM Solutions. https://itsmsolutions.com/wp-content/uploads/2013/12/DITY_Vol4_Issue47.pdf
Lucidchart. (n.d.). Root cause analysis: Definition, examples, and tools. Lucidchart Blog. https://www.lucidchart.com/blog/root-cause-analysis
Microsoft Support. (n.d.). Create a fault tree analysis diagram. Microsoft. https://support.microsoft.com/en-us/office/create-a-fault-tree-analysis-diagram-6a66d2ea-5a4c-4a68-9af4-8bce8e84a220
Reliability. (n.d.). 7 root cause analysis tools. Reliability.com. https://reliability.com/7-root-cause-analysis-tools/
Software Engineering Institute. (2021, June 24). EMFTA: An open-source tool for fault tree analysis. Carnegie Mellon University. https://insights.sei.cmu.edu/blog/emfta-an-open-source-tool-for-fault-tree-analysis/
SolarWinds. (n.d.). ITSM problem management best practices. SolarWinds. https://www.solarwinds.com/resources/itm/itsm-problem-management-best-practices
The Decision Lab. (n.d.). Fault tree analysis. The Decision Lab. https://thedecisionlab.com/reference-guide/engineering/fault-tree-analysis
Vesely, W. E., Goldberg, F. F., Roberts, N. H., & Haasl, D. F. (1981). Fault tree handbook (NUREG-0492). U.S. Nuclear Regulatory Commission. https://www.nrc.gov/reading-rm/doc-collections/nuregs/staff/sr0492/
I am an accomplished IT leader with over 20 years of experience driving global infrastructure operations, developing hybrid cloud strategies, and managing IT service delivery. My career has been built on aligning technology with business outcomes — delivering resilient, cost-efficient, and secure IT environments that enable growth.
With a proven record of leading high-performing global teams, I bring expertise in ITIL-based process maturity, automation, and disaster recovery planning. I excel at defining multi-year infrastructure roadmaps, governing IT assets and CMDB data, and building cross-functional partnerships that improve service quality and strengthen business resilience.
Key Qualifications:
-
Strategic Roadmapping: Defined and executed multi-year infrastructure strategies that support business growth, hybrid cloud adoption, and continuous improvement.
-
Hybrid Cloud Leadership: Implemented and managed hybrid cloud strategies across AWS and Azure, optimizing scalability, performance, and cost efficiency.
-
IT Service Management: Matured ITIL processes (Incident, Major Incident, Problem, Availability, Capacity, ITAM/CMDB), improving reliability and service delivery.
- Automation & Modernization: Advanced automation and observability practices to reduce downtime, improve SLA compliance, and accelerate recovery.
- Disaster Recovery & Continuity: Designed and tested enterprise-level DR/BCP strategies, ensuring operational resilience and compliance.
- Global Team Leadership: Built and managed geographically distributed engineering and operations teams, fostering talent development and succession planning.
- Executive Collaboration: Partnered with senior leadership and business stakeholders to align IT strategy, improve transparency, and deliver measurable outcomes.
- Vendor & Budget Stewardship: Governed vendor performance and managed IT budgets with a focus on cost control, forecasting, and value optimization.
Copyright © 2025 Serhiy Kuzhanov. All rights reserved.
No part of this website may be reproduced, stored in a retrieval system, or transmitted in any form
or by any means without the written permission of the website owner.